The Boba News 2025
Inspiration
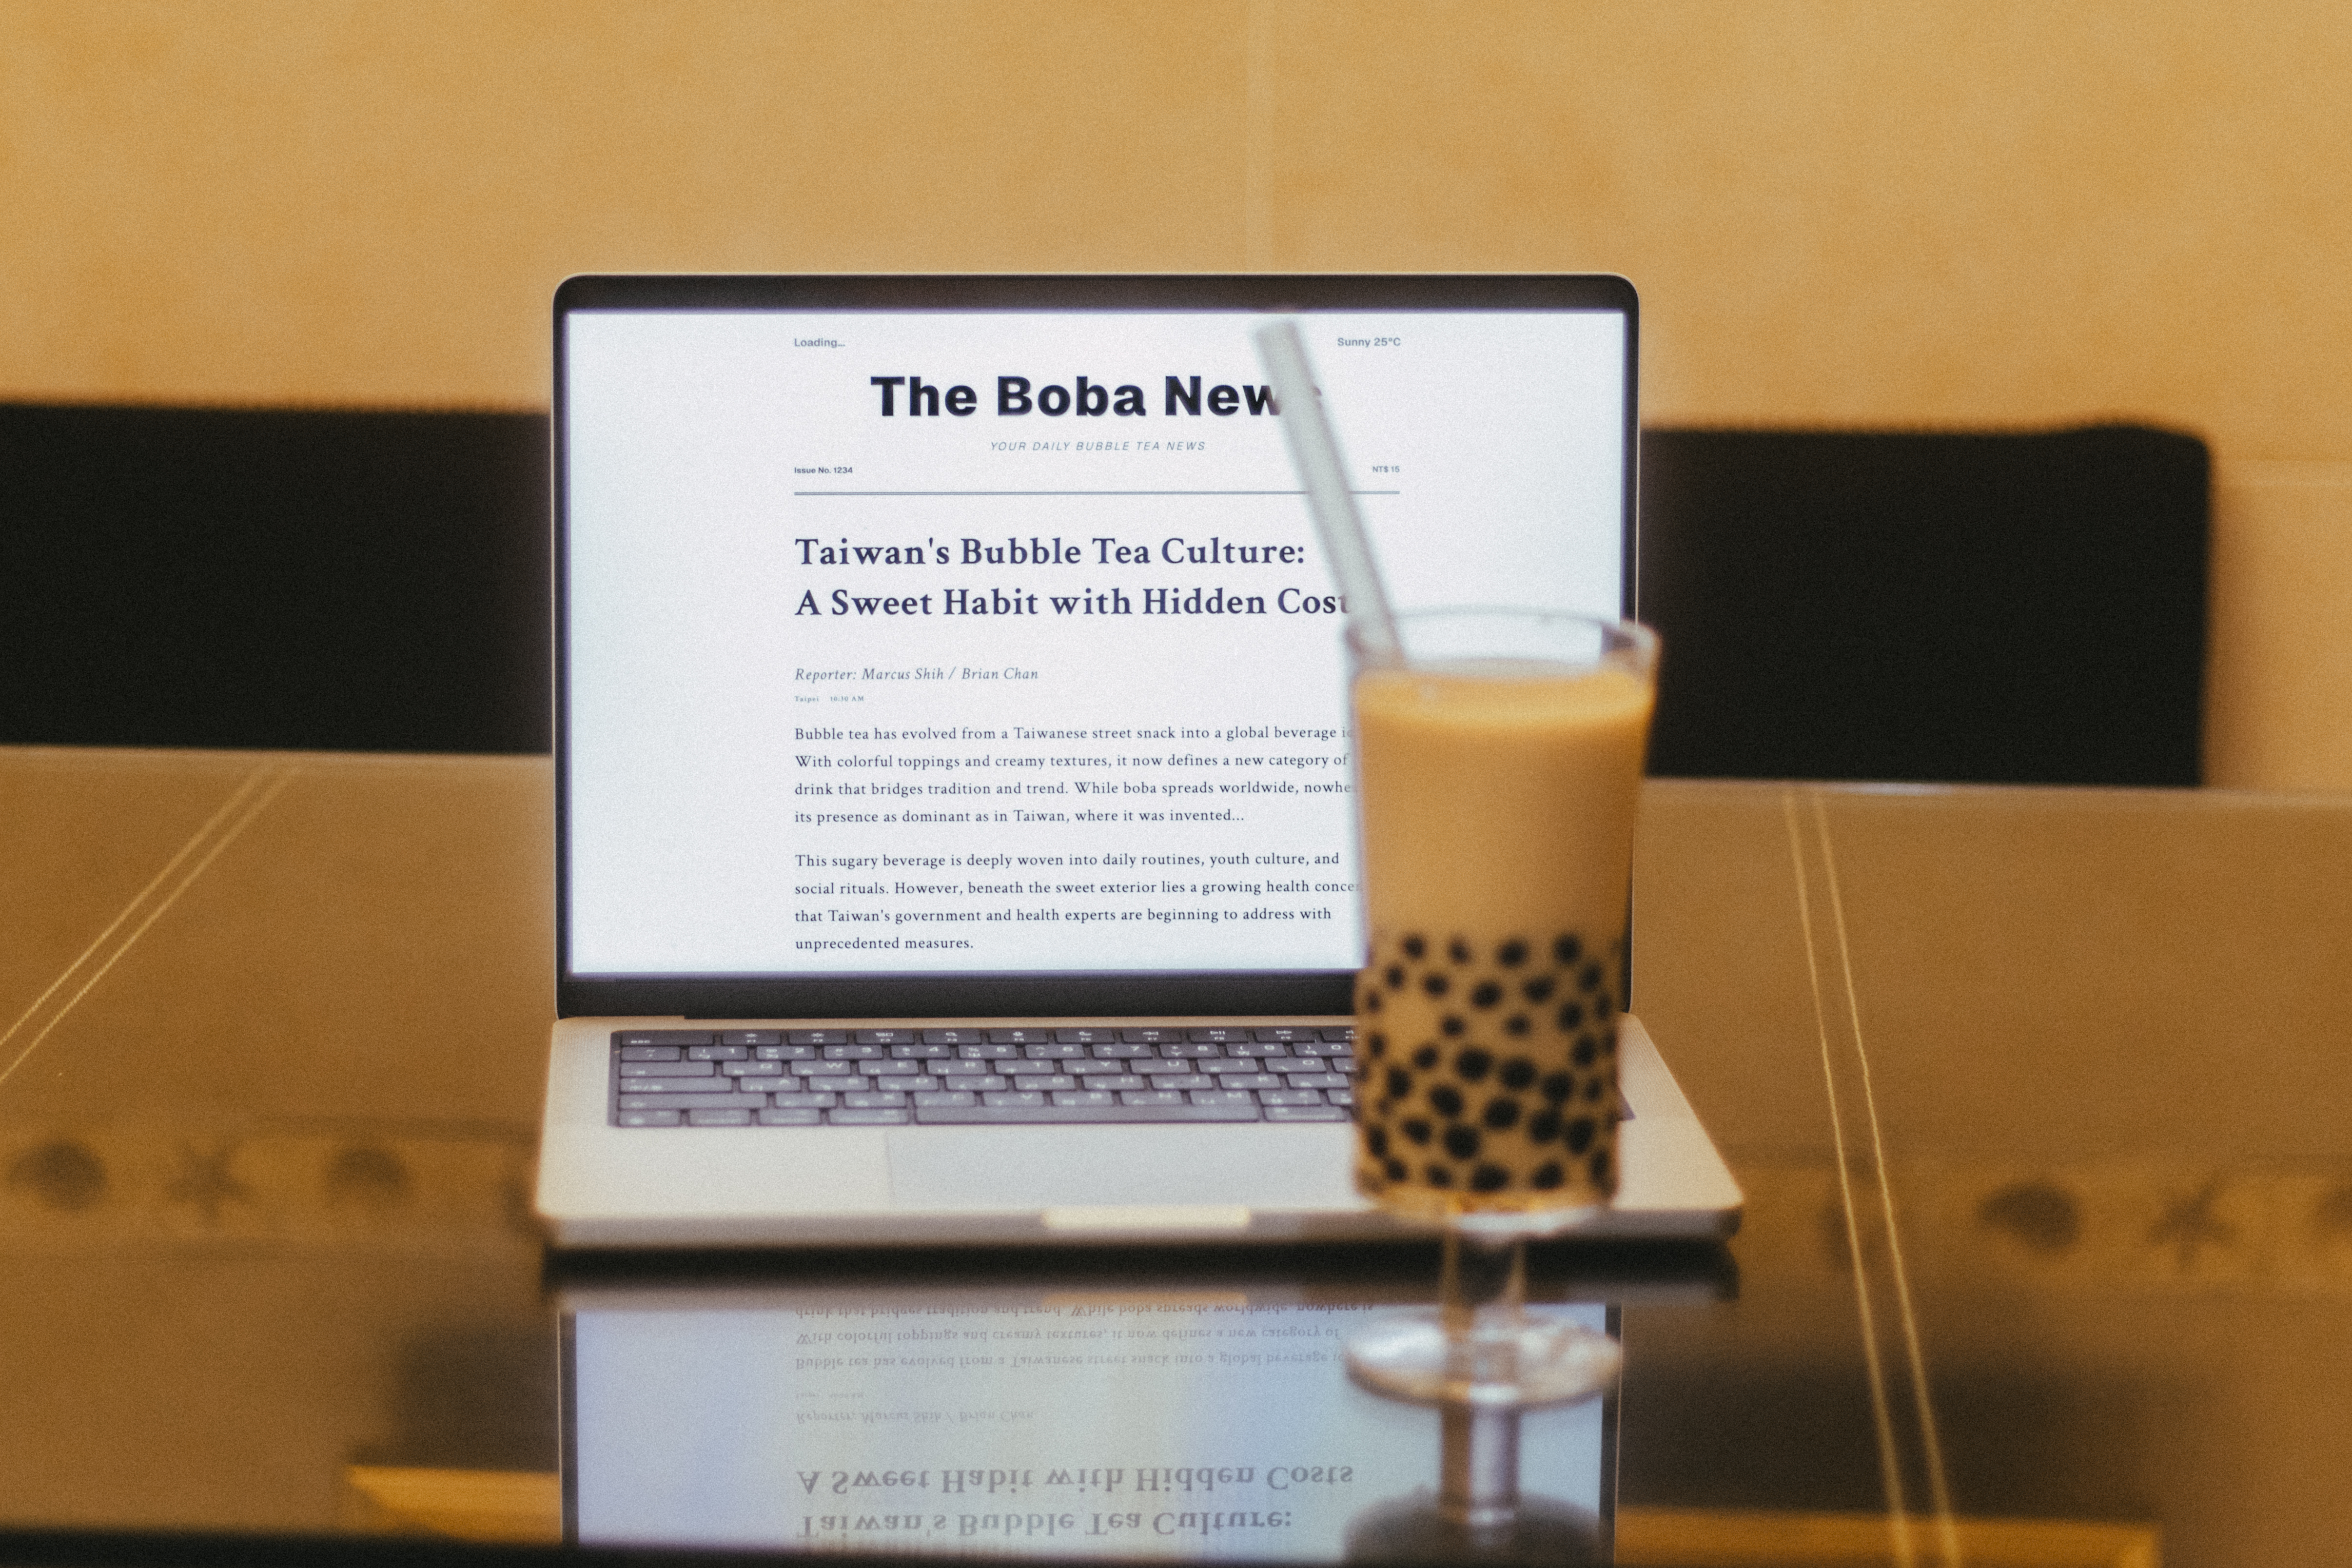
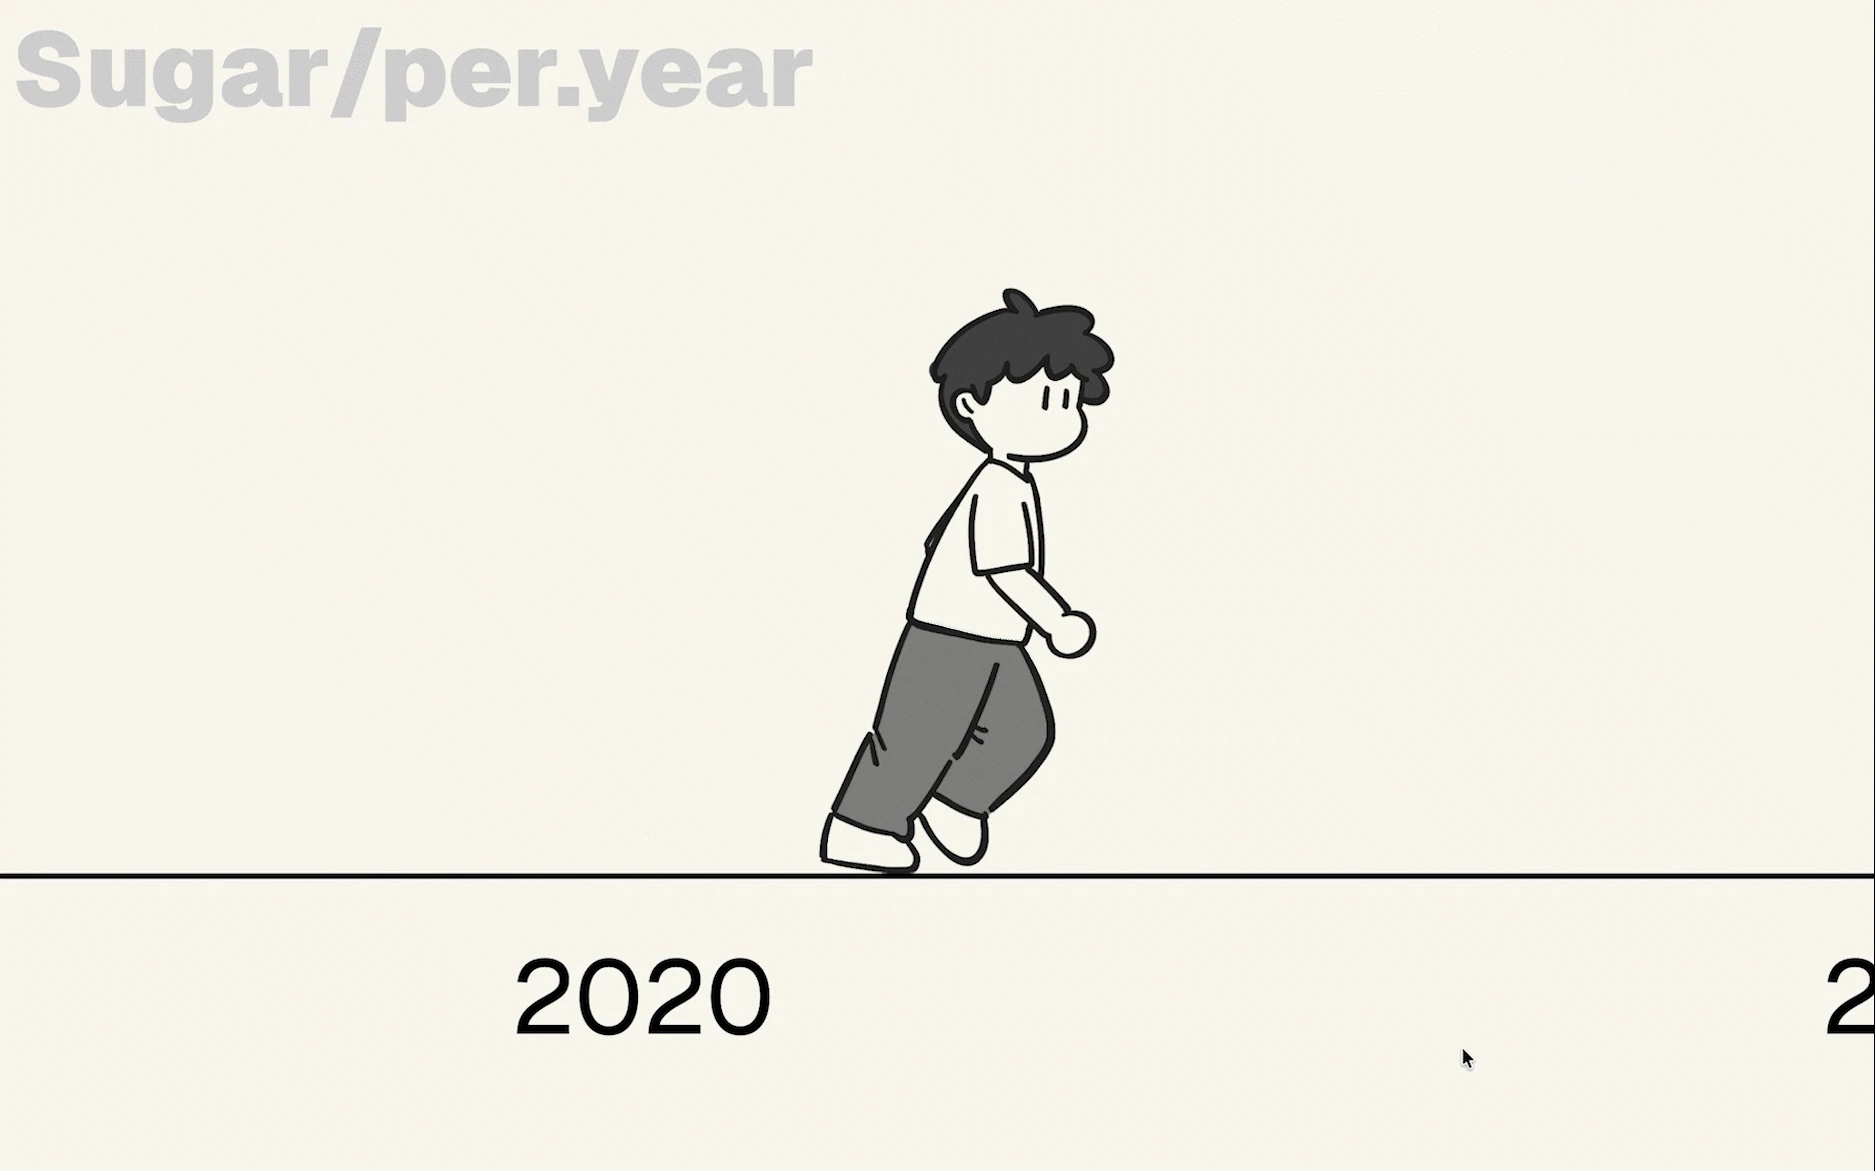
As a self-confessed bubble tea addict. This work aims to raise awareness among Taiwanese people about the crisis of excessive sugar intake caused by addiction to bubble tea, using an approach that differs from traditional reporting methods. Through vivid illustrations and interactive mechanisms, viewers can truly realize the increasing annual sugar intake and the actual sugar content in the bubble tea they consume on a daily basis.

Process
During the production process, since I’m not skilled in illustration, I invited my friend Brian to help create the artwork while I focused on the programming. This was our first time creating an interactive, report-style project.

Impact
We shared our report site on social media and invited about 50 participants to track their monthly boba tea consumption before and after visiting the site. After exploring the site, the proportion of participants drinking 0–5 cups per month increased significantly, while those consuming more than 10 cups decreased.
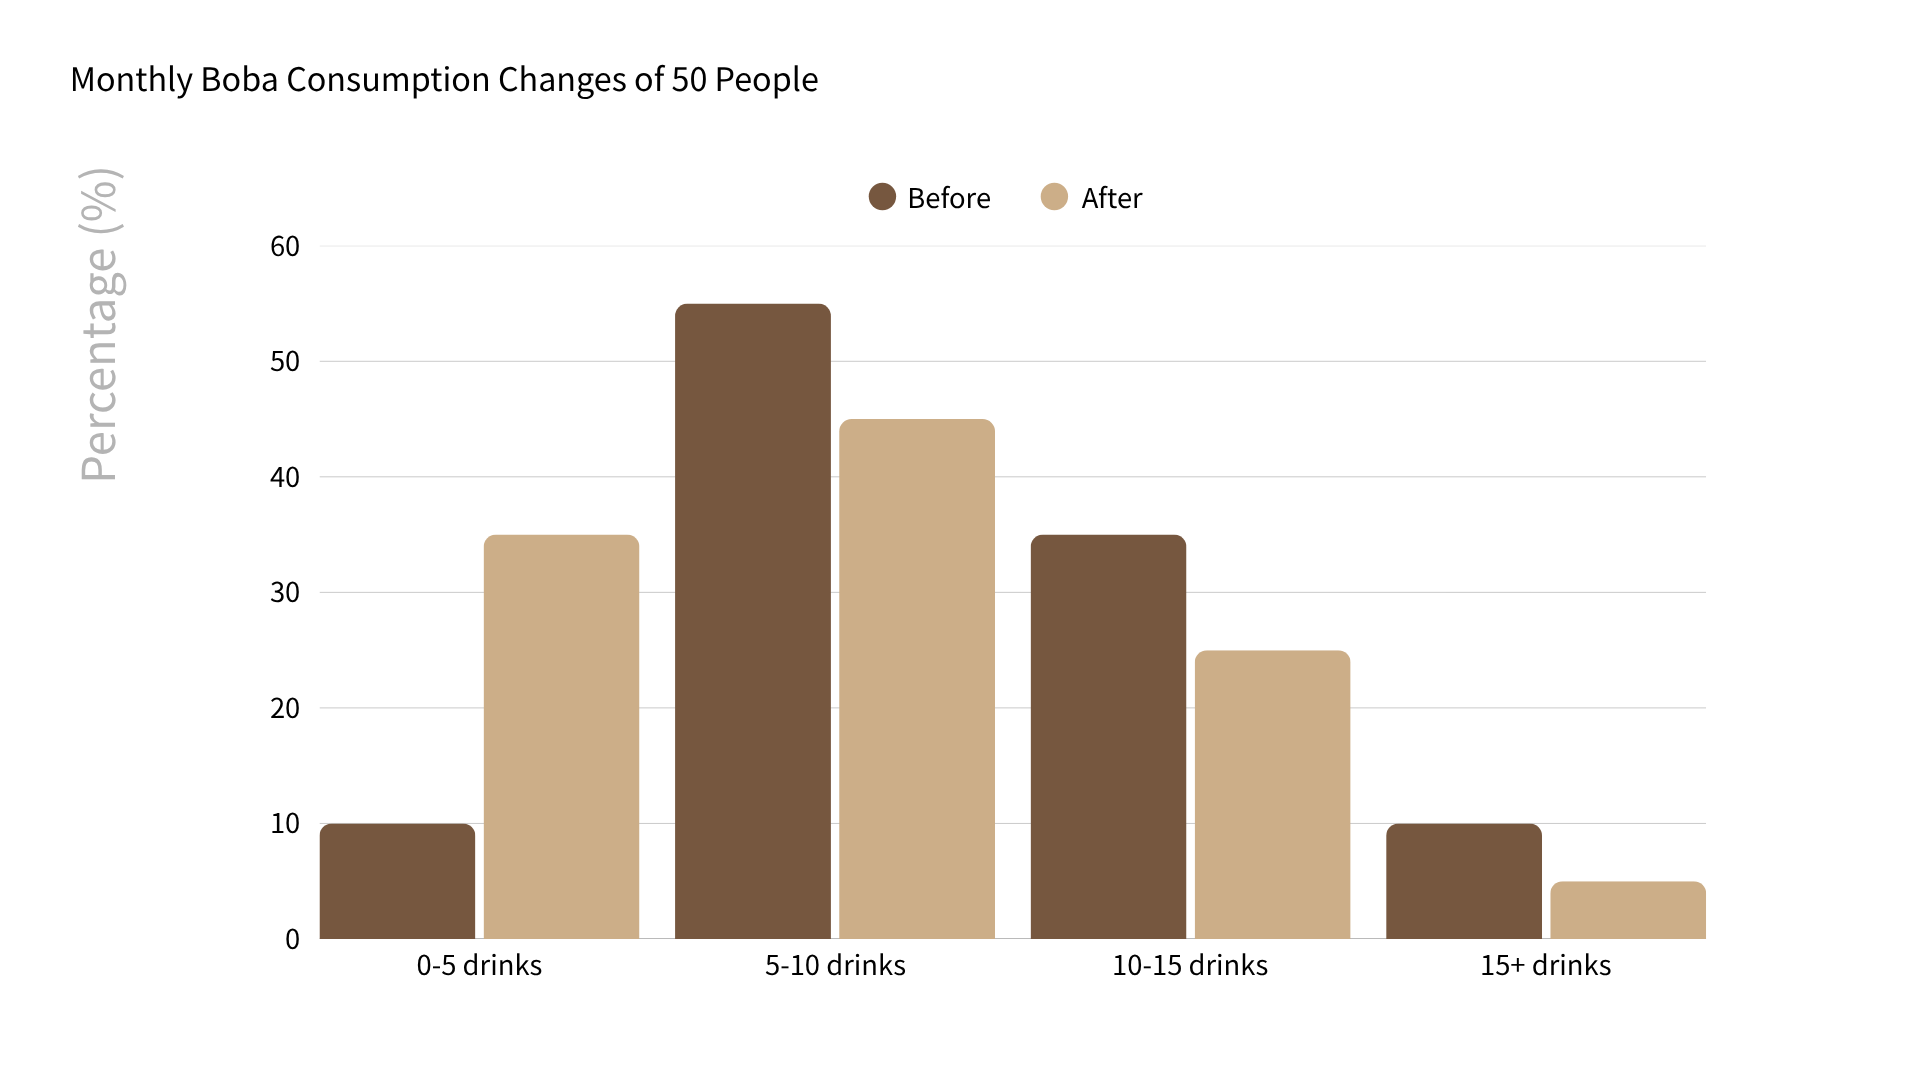
Monthly Boba Consumption Changes of 50 People. The vertical axis is percentage, and the horizontal axis groups monthly consumption into 0–5, 5–10, 10–15, and 15 or more drinks. Approximate values read from the bars, before and after viewing the report respectively: 0–5 drinks, 10% and 35%; 5–10 drinks, 55% and 45%; 10–15 drinks, 35% and 25%; 15 or more drinks, 10% and 5%. These are the values displayed in the chart, not a recalculation of the survey results.